Full Celery, Flower, RabbitMQ and Grafana ML Deployment Guide
2024-01-02
Contents
- Introduction
- Nginx
- RabbitMQ
- Postgres
- Flower
- Monitoring: Grafana and Prometheus
- Celery Workers
- Closing Notes
Introduction
I’m going to assume you already read my previous blogpost but now wish to go one step further and also add monitoring and a working API. The following figure shows an overview of the setup we will try to build.

There’s quite a lot we need to setup in our docker-compose.yml file, namely 7 services in total.
- Grafana and Prometheus: those will be our monitoring tools. Grafana will be what you will actually look and and Prometheus will provide the data for Grafana.
- Flower will talk with the Celery workers and provide us with some very useful API features, such as being able to send tasks to the workers as well as check the tasks’ status.
- Postgres will be the result backend for the Celery workers.
- RabbitMQ will be the message broker for the Celery workers.
- Nginx is the reverse proxy behind which everything will run. We will use it to protect our API from unauthorized users.
- Backend API: this will be any backend which will hold our business logic.
The important part is that the backend API will send tasks to the workers via Flower, which provides a RESTful API. This means our backend API doesn’t have to be written in Python! If Flower didn’t exist, we would have to import the Celery app and use the send_task function of the Celery app object, restricting us to use Python as our backend. With Flower, we can just send a post request to the Flower API, which will forward our request to the Celery workers.

Flower, under the hood, is just a Python Tornado application, which instantiates the Celery app object and then simply calls the send_task function to create a task for the workers. Once the workers are done, the result is written in the result backend.
We will create a docker-compose.yml file, where we will put everything in.
Nginx
The first thing we will setup is Nginx, our reverse proxy. There are 2 things we need: a Dockerfile.nginx file, which contains the dockerised Nginx, as well as the nginx.conf file, which is our Nginx configuration. Let’s start with the Dockerfile.
FROM nginx:stable-alpine

# Remove default nginx configuration
RUN rm /etc/nginx/conf.d/default.conf

# Copy nginx configuration
COPY nginx.conf /etc/nginx/nginx.conf

# Expose ports
EXPOSE 80
EXPOSE 443

# Run Nginx
CMD ["nginx", "-g", "daemon off;"]
Along with this Dockerfile, we also need the nginx.conf file, so let’s set it up. We will gradually add more to this file as we go along.
user nginx;
worker_processes 2;

error_log /var/log/nginx/error.log;
pid /var/run/nginx.pid;

events {
  worker_connections 1024;
  use epoll;
}
http {
  # we will add the stuff in here later
}
Now that we have our Nginx configuration, we can add it to our docker-compose.yml file.
version: "3.8"
services:
  nginx:
    build:
      context: .
      dockerfile: Dockerfile.nginx
    volumes:
      - /etc/letsencrypt:/etc/letsencrypt
    ports:
      - "80:80"
      - "443:443"
We can now run docker compose up and see if everything works.
RabbitMQ
Now, we will setup RabbitMQ. We will use the official RabbitMQ docker image for this. Let’s add this part to the docker-compose.yml file.
version: "3.8"
services:
  rabbitmq:
    image: rabbitmq:3-management
    hostname: rabbit_hostname
    container_name: rabbitmq
    environment:
      RABBITMQ_DEFAULT_USER: user
      RABBITMQ_DEFAULT_PASS: password
    ports:
      - "4369:4369"
      - "5671:5671"
      - "5672:5672"
      - "15671:15671"
      - "15691-15692:15691-15692"
      - "25672:25672"
      - "15672:15672"
  nginx:
    build:
      context: .
      dockerfile: Dockerfile.nginx
    volumes:
      - /etc/letsencrypt:/etc/letsencrypt
    ports:
      - "80:80"
      - "443:443"
    depends_on:
      - rabbitmq
You will notice that I also forwarded some ports. I’m actually not sure if we even need all of them at this point. We will do an ablation study later. For now, I’ve just added all of them. We also want the Nginx container to start up last, so we add a depends_on field.
Let’s go ahead and add this to the nginx.conf file.
user nginx;
worker_processes 2;

error_log /var/log/nginx/error.log;
pid /var/run/nginx.pid;

events {
  worker_connections 1024;
  use epoll;
}
http {
  upstream rabbitmq_management {
    server rabbitmq:15672;
  }

  server {
    listen 80;
    # server_name your_domain.com;

    # comment this if you want to use https
    location / {
      proxy_pass http://rabbitmq_management;
      proxy_set_header Host $http_host;
      proxy_set_header X-Real-IP $remote_addr;
      proxy_set_header X-Forwarded-For $proxy_add_x_forwarded_for;
      proxy_set_header X-Forwarded-Proto $scheme;
      proxy_read_timeout 300;
      proxy_connect_timeout 300;
      proxy_redirect off;
    }

    # uncomment this if you want to use https
    # return 301 https://$host$request_uri;
  }

  # uncomment this if you want to use https
  # server {
  #   listen 443 ssl;
  #   server_name your_domain.com;
  #
  #   ssl_certificate /etc/letsencrypt/live/your_domain.com/fullchain.pem; # Adjust to your certificate's path
  #   ssl_certificate_key /etc/letsencrypt/live/your_domain.com/privkey.pem; # Adjust to your key's path
  #   include /etc/letsencrypt/options-ssl-nginx.conf; # managed by Certbot
  #
  #   location / {
  #     proxy_pass http://rabbitmq_management;
  #     proxy_set_header Host $http_host;
  #     proxy_set_header X-Real-IP $remote_addr;
  #     proxy_set_header X-Forwarded-For $proxy_add_x_forwarded_for;
  #     proxy_set_header X-Forwarded-Proto $scheme;
  #     proxy_read_timeout 300;
  #     proxy_connect_timeout 300;
  #     proxy_redirect off;
  #   }
  # }
}
Running docker compose up should now start up both Nginx and RabbitMQ. If you navigate to localhost:15672, you should see the RabbitMQ management interface. You can login with the credentials we set in the docker-compose.yml file.
That’s all we need for now.
Postgres
Next up is Postgres. We will use the official Postgres docker image for this. Let’s add this part to the docker-compose.yml file.
version: "3.8"
services:
  rabbitmq:
    image: rabbitmq:3-management
    hostname: rabbit_hostname
    container_name: rabbitmq
    environment:
      RABBITMQ_DEFAULT_USER: user
      RABBITMQ_DEFAULT_PASS: password
    ports:
      - "4369:4369"
      - "5671:5671"
      - "5672:5672"
      - "15671:15671"
      - "15691-15692:15691-15692"
      - "25672:25672"
      - "15672:15672"
  postgres:
    image: postgres:latest
    environment:
      POSTGRES_DB: main
      POSTGRES_USER: user
      POSTGRES_PASSWORD: password
    ports:
      - "5432:5432"
  nginx:
    build:
      context: .
      dockerfile: Dockerfile.nginx
    volumes:
      - /etc/letsencrypt:/etc/letsencrypt
    ports:
      - "80:80"
      - "443:443"
    depends_on:
      - rabbitmq
      - postgres
Flower
The next step is setting up Flower. We will use the official Flower docker image for that. Let’s add that to our docker-compose.yml file.
version: "3.8"
services:
  rabbitmq:
    image: rabbitmq:3-management
    hostname: rabbit_hostname
    container_name: rabbitmq
    environment:
      RABBITMQ_DEFAULT_USER: user
      RABBITMQ_DEFAULT_PASS: password
    ports:
      - "4369:4369"
      - "5671:5671"
      - "5672:5672"
      - "15671:15671"
      - "15691-15692:15691-15692"
      - "25672:25672"
      - "15672:15672"
  postgres:
    image: postgres:latest
    environment:
      POSTGRES_DB: main
      POSTGRES_USER: user
      POSTGRES_PASSWORD: password
    ports:
      - "5432:5432"
  flower:
    image: mher/flower
    environment:
      - FLOWER_PERSISTENT=True
      - FLOWER_DB=/etc/db/flower.db
    depends_on:
      - rabbitmq
    command: celery --broker=amqp://user:password@rabbit_hostname:5672// flower --basic-auth=some_user:some_password
    ports:
      - "5555:5555"
    volumes:
      - ./flower/storage:/etc/db/
  nginx:
    build:
      context: .
      dockerfile: Dockerfile.nginx
    volumes:
      - /etc/letsencrypt:/etc/letsencrypt
    ports:
      - "80:80"
      - "443:443"
    depends_on:
      - rabbitmq
We will also need to add some stuff to our nginx.conf file.
# ... the rest of the file
  upstream flower {
    server flower:5555;
  }

  server {
    listen 80;
    # comment this if you want to use https
    # server_name your_domain.com;

    # comment this if you want to use https
    location / {
      limit_except GET POST OPTIONS {
        deny all;
      }
      proxy_pass_header Server;
      proxy_set_header Host $http_host;
      proxy_http_version 1.1;
      proxy_set_header Upgrade $http_upgrade;
      proxy_set_header Connection "upgrade";
      proxy_pass http://flower;

      if ($request_method = 'OPTIONS') {
        add_header 'Access-Control-Allow-Origin' '*';
        add_header 'Access-Control-Allow-Methods' 'GET, POST, OPTIONS';
        add_header 'Access-Control-Allow-Headers' 'Origin, X-Requested-With, Content-Type, Accept, Authorization';
        add_header 'Access-Control-Max-Age' 86400;
        add_header 'Content-Type' 'text/plain charset=UTF-8';
        add_header 'Content-Length' 0;
        return 204;
      }
      add_header 'Access-Control-Allow-Origin' '*';
      add_header 'Access-Control-Allow-Methods' 'GET, POST, OPTIONS';
      add_header 'Access-Control-Allow-Headers' 'Origin, X-Requested-With, Content-Type, Accept, Authorization';
    }
    # uncomment this if you want to use https
    # return 301 https://$host$request_uri;
  }
  # uncomment this if you want to use https
  # server {
  #   listen 443 ssl;
  #   server_name your_domain.com;
  #   client_max_body_size 40m;
  #   ssl_certificate /etc/letsencrypt/live/your_domain.com/fullchain.pem;
  #   ssl_certificate_key /etc/letsencrypt/live/your_domain.com/privkey.pem;
  #   include /etc/letsencrypt/options-ssl-nginx.conf; # managed by Certbot
  #
  #   location / {
  #     limit_except GET POST OPTIONS {
  #       deny all;
  #     }
  #     proxy_pass_header Server;
  #     proxy_set_header Host $http_host;
  #     proxy_http_version 1.1;
  #     proxy_set_header Upgrade $http_upgrade;
  #     proxy_set_header Connection "upgrade";
  #     proxy_pass http://flower;
  #
  #     if ($request_method = 'OPTIONS') {
  #       add_header 'Access-Control-Allow-Origin' '*';
  #       add_header 'Access-Control-Allow-Methods' 'GET, POST, OPTIONS';
  #       add_header 'Access-Control-Allow-Headers' 'Origin, X-Requested-With, Content-Type, Accept, Authorization';
  #       add_header 'Access-Control-Max-Age' 86400;
  #       add_header 'Content-Type' 'text/plain charset=UTF-8';
  #       add_header 'Content-Length' 0;
  #       return 204;
  #     }
  #     add_header 'Access-Control-Allow-Origin' '*';
  #     add_header 'Access-Control-Allow-Methods' 'GET, POST, OPTIONS';
  #     add_header 'Access-Control-Allow-Headers' 'Origin, X-Requested-With, Content-Type, Accept, Authorization';
  #   }
  # }

  # ... the rest of the file
If you navigate to localhost:5555, you should see the Flower dashboard. You will have to login with the credentials we set in the docker-compose.yml file. Furthermore, if you try to perform a GET request to, e.g., localhost:5555/api/workers, you should get a 401 error. This is good for us, because we don’t want unauthorized users to make requests to our Flower API (which is the gateway to our Celery workers). By adding to the GET request a authorization header with the credentials we set in the docker-compose.yml file, we can make the request!
Monitoring: Grafana and Prometheus
Next up we will setup the monitoring tools for our Celery workers, which are Grafana and Prometheus. Let’s use the official Grafana and Prometheus docker images for this and add that to our docker-compose.yml file.
version: "3.8"
services:
  rabbitmq:
    image: rabbitmq:3-management
    hostname: rabbit_hostname
    container_name: rabbitmq
    environment:
      RABBITMQ_DEFAULT_USER: user
      RABBITMQ_DEFAULT_PASS: password
    ports:
      - "4369:4369"
      - "5671:5671"
      - "5672:5672"
      - "15671:15671"
      - "15691-15692:15691-15692"
      - "25672:25672"
      - "15672:15672"
  postgres:
    image: postgres:latest
    environment:
      POSTGRES_DB: main
      POSTGRES_USER: user
      POSTGRES_PASSWORD: password
    ports:
      - "5432:5432"
  flower:
    image: mher/flower
    container_name: flower
    environment:
      - FLOWER_PERSISTENT=True
      - FLOWER_DB=/etc/db/flower.db
    depends_on:
      - rabbitmq
    command: celery --broker=amqp://user:password@rabbit_hostname:5672// flower --basic-auth=some_user:some_password
    ports:
      - "5555:5555"
    volumes:
      - ./flower/storage:/etc/db/
  prometheus:
    container_name: prometheus
    volumes:
      - ./prometheus.yml:/etc/prometheus/prometheus.yml
    ports:
      - 9090:9090
    image: prom/prometheus
  grafana:
    container_name: grafana
    volumes:
      - ./grafana_storage:/var/lib/grafana
    ports:
      - 3000:3000
    image: grafana/grafana
  nginx:
    build:
      context: .
      dockerfile: Dockerfile.nginx
    volumes:
      - /etc/letsencrypt:/etc/letsencrypt
    ports:
      - "80:80"
      - "443:443"
    depends_on:
      - rabbitmq
      - flower
      - prometheus
      - grafana
We will also need to add some stuff to our nginx.conf file.
  # ... the rest of the file
  upstream prometheus {
    server prometheus:9090;
  }

  server {
    listen 80;
    # comment this if you want to use https
    location / {
      limit_except GET POST OPTIONS {
        deny all;
      }
      proxy_pass_header Server;
      proxy_set_header Host $http_host;
      proxy_http_version 1.1;
      proxy_set_header Upgrade $http_upgrade;
      proxy_set_header Connection "upgrade";
      proxy_pass http://prometheus;

      if ($request_method = 'OPTIONS') {
        add_header 'Access-Control-Allow-Origin' '*';
        add_header 'Access-Control-Allow-Methods' 'GET, POST, OPTIONS';
        add_header 'Access-Control-Allow-Headers' 'Origin, X-Requested-With, Content-Type, Accept, Authorization';
        add_header 'Access-Control-Max-Age' 86400;
        add_header 'Content-Type' 'text/plain charset=UTF-8';
        add_header 'Content-Length' 0;
        return 204;
      }
      add_header 'Access-Control-Allow-Origin' '*';
      add_header 'Access-Control-Allow-Methods' 'GET, POST, OPTIONS';
      add_header 'Access-Control-Allow-Headers' 'Origin, X-Requested-With, Content-Type, Accept, Authorization';
    }
    # server_name your_domain.com;

    # uncomment this if you want to use https
    # return 301 https://$host$request_uri;
  }

  # server {
  #   listen 443 ssl;
  #   server_name your_domain.com;
  #   client_max_body_size 40m;
  #   ssl_certificate /etc/letsencrypt/live/your_domain.com/fullchain.pem;
  #   ssl_certificate_key /etc/letsencrypt/live/your_domain.com/privkey.pem;
  #   include /etc/letsencrypt/options-ssl-nginx.conf; # managed by Certbot
  #
  #   location / {
  #     limit_except GET POST OPTIONS {
  #       deny all;
  #     }
  #     proxy_pass_header Server;
  #     proxy_set_header Host $http_host;
  #     proxy_http_version 1.1;
  #     proxy_set_header Upgrade $http_upgrade;
  #     proxy_set_header Connection "upgrade";
  #     proxy_pass http://prometheus;
  #
  #     if ($request_method = 'OPTIONS') {
  #       add_header 'Access-Control-Allow-Origin' '*';
  #       add_header 'Access-Control-Allow-Methods' 'GET, POST, OPTIONS';
  #       add_header 'Access-Control-Allow-Headers' 'Origin, X-Requested-With, Content-Type, Accept, Authorization';
  #       add_header 'Access-Control-Max-Age' 86400;
  #       add_header 'Content-Type' 'text/plain charset=UTF-8';
  #       add_header 'Content-Length' 0;
  #       return 204;
  #     }
  #     add_header 'Access-Control-Allow-Origin' '*';
  #     add_header 'Access-Control-Allow-Methods' 'GET, POST, OPTIONS';
  #     add_header 'Access-Control-Allow-Headers' 'Origin, X-Requested-With, Content-Type, Accept, Authorization';
  #   }
  # }

  upstream grafana {
    server grafana:3000;
  }

  server {
    listen 80;

    # comment this if you want to use https
    location / {
      proxy_pass_header Server;
      proxy_set_header Host $http_host;
      proxy_http_version 1.1;
      proxy_set_header Upgrade $http_upgrade;
      proxy_set_header Connection "upgrade";
      proxy_pass http://grafana;

      if ($request_method = 'OPTIONS') {
        add_header 'Access-Control-Allow-Origin' '*';
        add_header 'Access-Control-Allow-Methods' 'GET, POST, OPTIONS';
        add_header 'Access-Control-Allow-Headers' 'Origin, X-Requested-With, Content-Type, Accept, Authorization';
        add_header 'Access-Control-Max-Age' 86400;
        add_header 'Content-Type' 'text/plain charset=UTF-8';
        add_header 'Content-Length' 0;
        return 204;
      }
      add_header 'Access-Control-Allow-Origin' '*';
      add_header 'Access-Control-Allow-Methods' 'GET, POST, OPTIONS';
      add_header 'Access-Control-Allow-Headers' 'Origin, X-Requested-With, Content-Type, Accept, Authorization';
    }
    # uncomment this if you want to use https
    # server_name your_domain.com;
    # return 301 https://$host$request_uri;
  }

  # server {
  #   listen 443 ssl;
  #   server_name your_domain.com;
  #   client_max_body_size 40m;
  #   ssl_certificate /etc/letsencrypt/live/your_domain.com/fullchain.pem;
  #   ssl_certificate_key /etc/letsencrypt/live/your_domain.com/privkey.pem;
  #   include /etc/letsencrypt/options-ssl-nginx.conf; # managed by Certbot
  #
  #   location / {
  #     proxy_pass_header Server;
  #     proxy_set_header Host $http_host;
  #     proxy_http_version 1.1;
  #     proxy_set_header Upgrade $http_upgrade;
  #     proxy_set_header Connection "upgrade";
  #     proxy_pass http://grafana;
  #
  #     if ($request_method = 'OPTIONS') {
  #       add_header 'Access-Control-Allow-Origin' '*';
  #       add_header 'Access-Control-Allow-Methods' 'GET, POST, OPTIONS';
  #       add_header 'Access-Control-Allow-Headers' 'Origin, X-Requested-With, Content-Type, Accept, Authorization';
  #       add_header 'Access-Control-Max-Age' 86400;
  #       add_header 'Content-Type' 'text/plain charset=UTF-8';
  #       add_header 'Content-Length' 0;
  #       return 204;
  #     }
  #     add_header 'Access-Control-Allow-Origin' '*';
  #     add_header 'Access-Control-Allow-Methods' 'GET, POST, OPTIONS';
  #     add_header 'Access-Control-Allow-Headers' 'Origin, X-Requested-With, Content-Type, Accept, Authorization';
  #   }
  # }
  # ... the rest of the file
We will also need to add a prometheus.yml file, which will be the configuration for Prometheus.
global:
  scrape_interval: 15s
  evaluation_interval: 15s

scrape_configs:
  - job_name: prometheus
    static_configs:
      - targets: ["prometheus:9090"]
  - job_name: flower
    static_configs:
      - targets: ["flower:5555"]
One thing to note is that since both Grafana and Prometheus are running based on the same docker-compose.yml file, we can use the container names as the hostnames for the prometheus.yml file. This is why we have prometheus:9090 and flower:5555 as the targets. We also create a couple of folders for Grafana and Prometheus to store their data in.
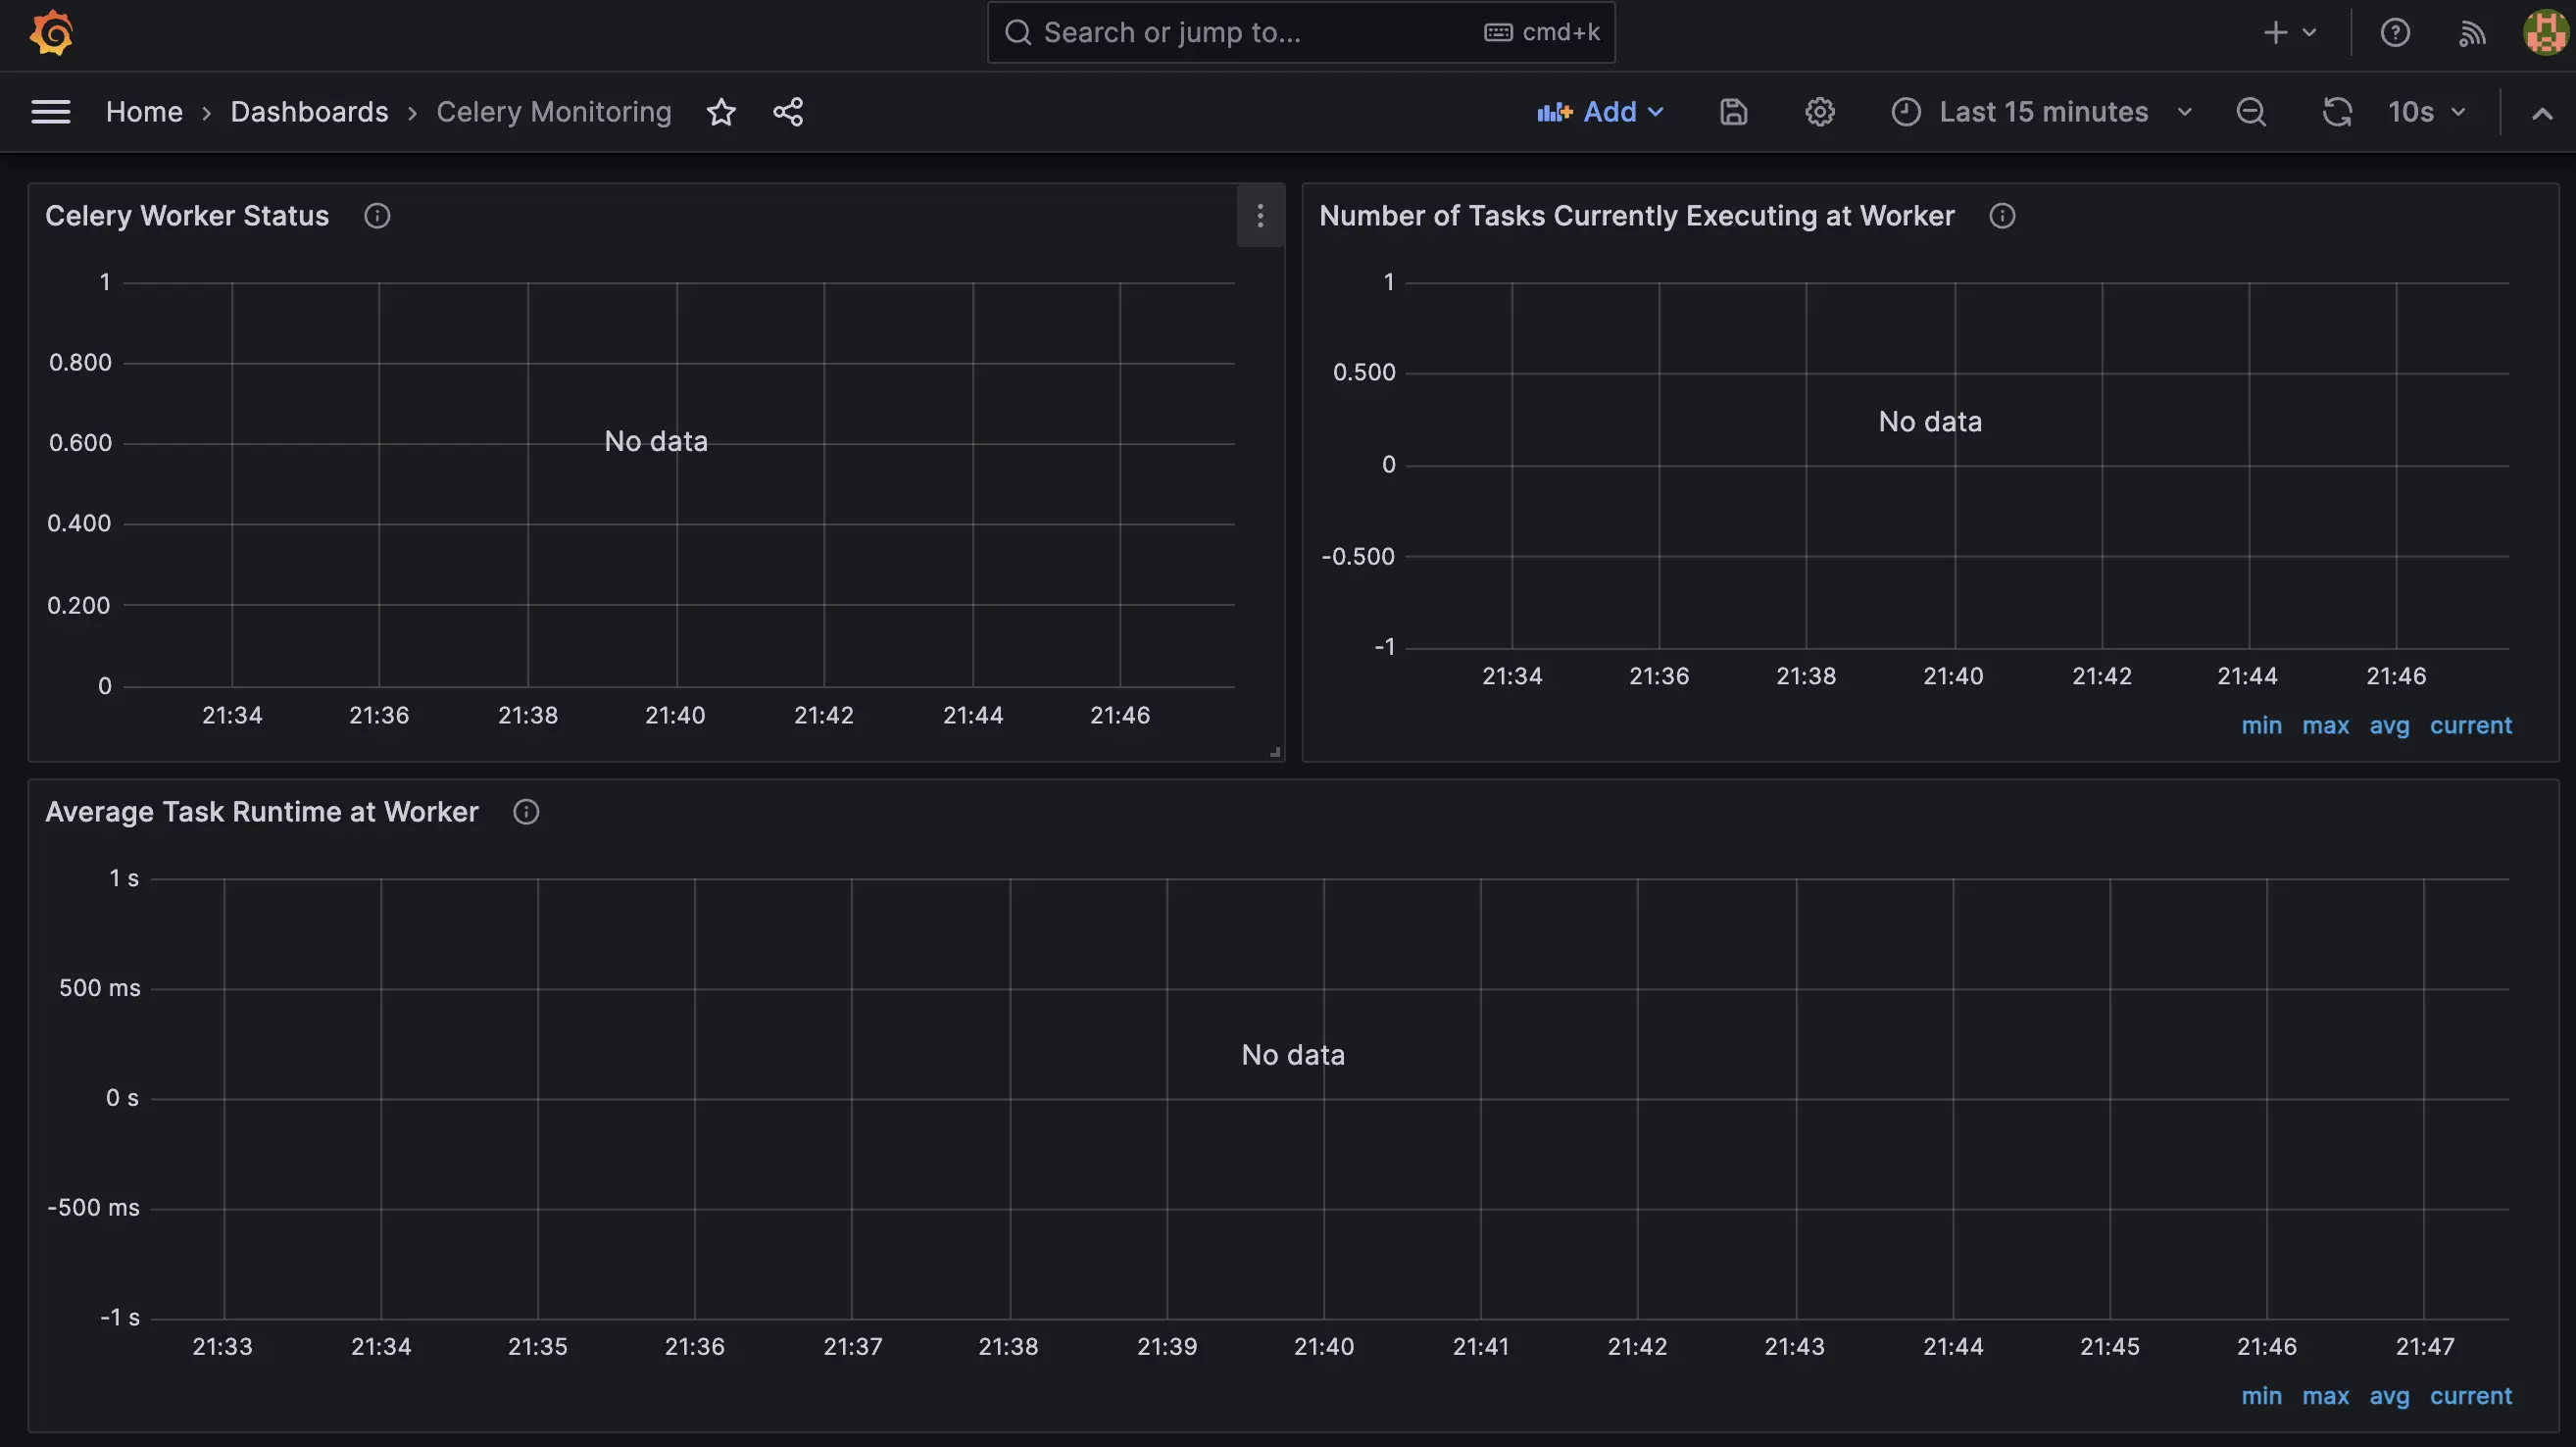
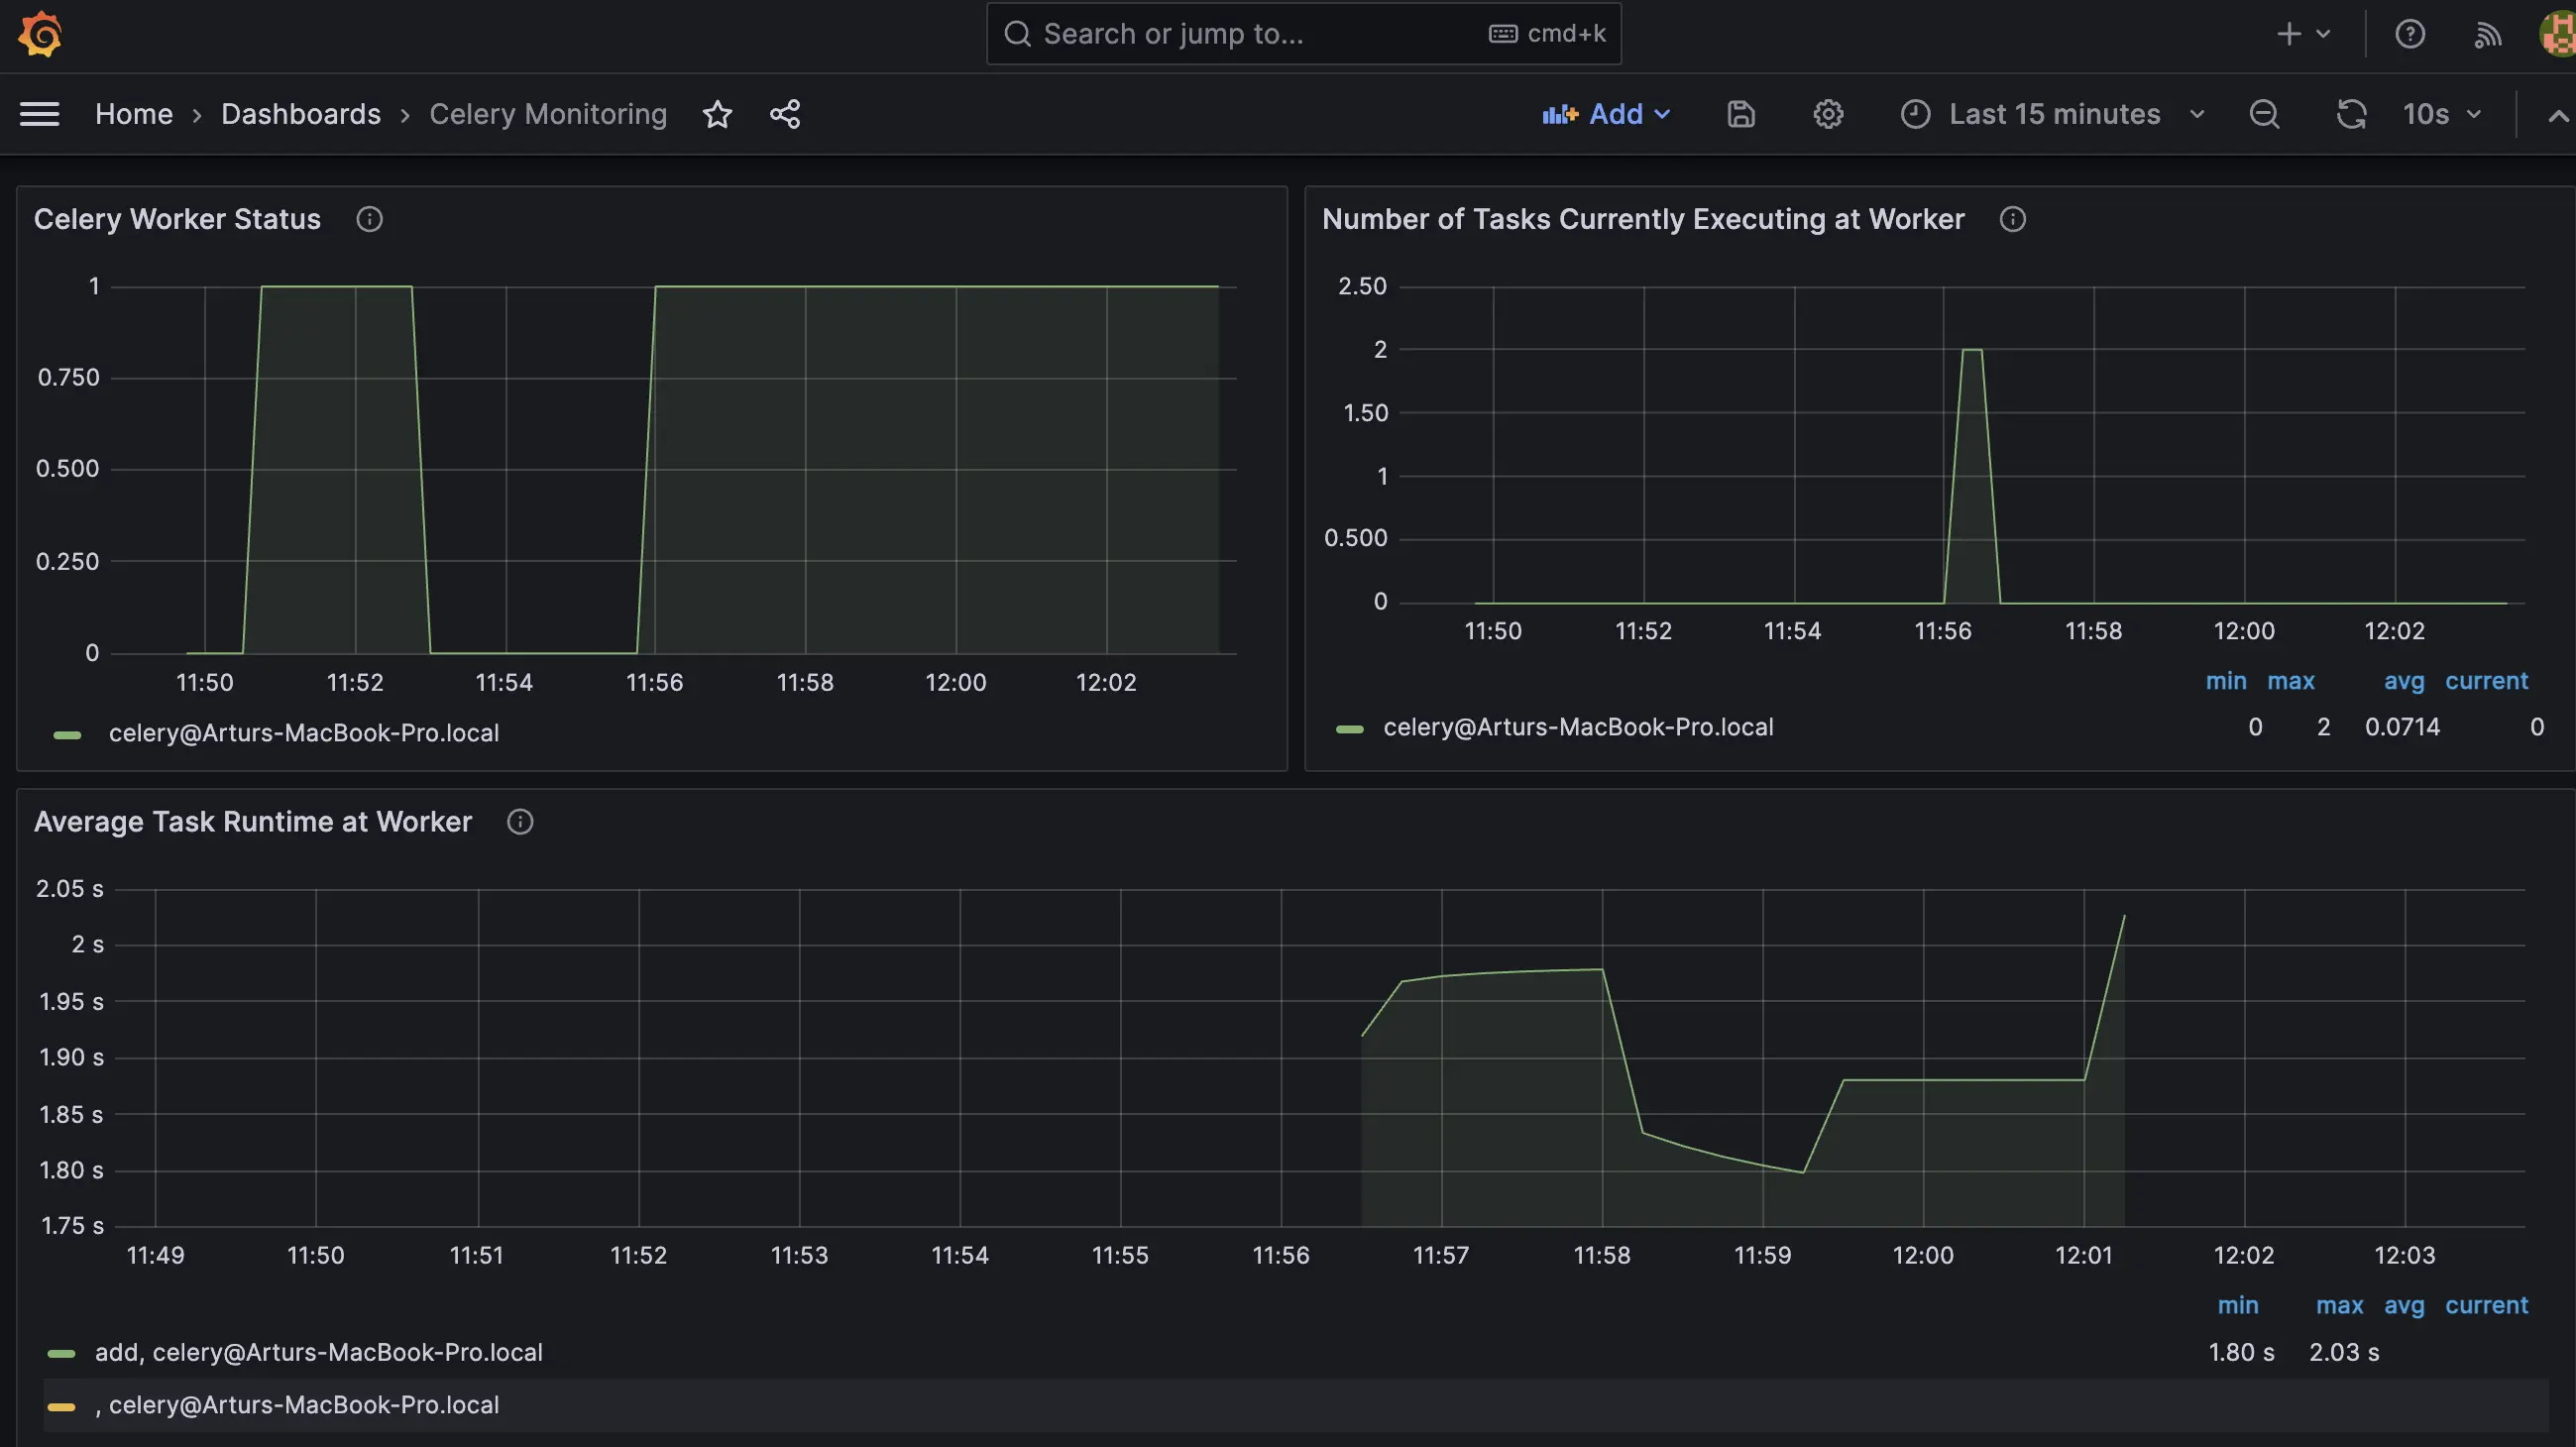
Once you run docker compose up, you should be able to navigate to localhost:3000 and see the Grafana dashboard. I would then highly suggest you read the tutorial provided from Flower to setup the Prometheus and Grafana dashboards. When you setup the monitoring, the connection URL in the Grafana dashboard should be http://prometheus:9090 rather than http://localhost:9090, since we are running everything using the same network and the container name is prometheus. Finally, it should look like this:
Celery Workers
The last missing part is the Celery workers and this depends on what you want to build. For this tutorial, we will use a simple Python script which will just sleep for a couple of seconds and then perform addition of 2 numbers.
In my case, I have used Poetry to manage the dependencies and there are a few you will need.
[tool.poetry]
name = "celery-workers"
version = "0.1.0"
description = ""
authors = ["Artur A. Galstyan <***>"]
readme = "README.md"

[tool.poetry.dependencies]
python = "^3.12"
celery = "^5.3.6"
python-dotenv = "^1.0.0"
sqlalchemy = "^2.0.25"
psycopg2-binary = "^2.9.9"


[build-system]
requires = ["poetry-core"]
build-backend = "poetry.core.masonry.api"

[tool.poetry.scripts]
start_workers = "celery_workers.worker:start"
I’ve also added a start_workers script, which we can easily use to start the workers. Here’s the code for the workers.
import os
import random
import time

from celery import Celery
from dotenv import load_dotenv

load_dotenv()

CELERY_BROKER_URL = os.getenv("CELERY_BROKER_URL")
CELERY_RESULT_BACKEND = os.getenv("CELERY_RESULT_BACKEND")

assert (
    CELERY_BROKER_URL is not None and CELERY_RESULT_BACKEND is not None
), "Celery broker URL and result backend must be set"

celery = Celery(__name__, broker=CELERY_BROKER_URL, backend=CELERY_RESULT_BACKEND)


@celery.task(name="add")
def add(x, y):
    time.sleep(random.randint(1, 3))
    return x + y


def start():
    celery.worker_main(argv=["worker", "--loglevel=INFO"])
We will also need a .env file, which will contain the environment variables for the Celery workers.
CELERY_BROKER_URL=amqp://user:password@localhost:5672//
CELERY_RESULT_BACKEND=db+postgresql://user:password@localhost:5432/main
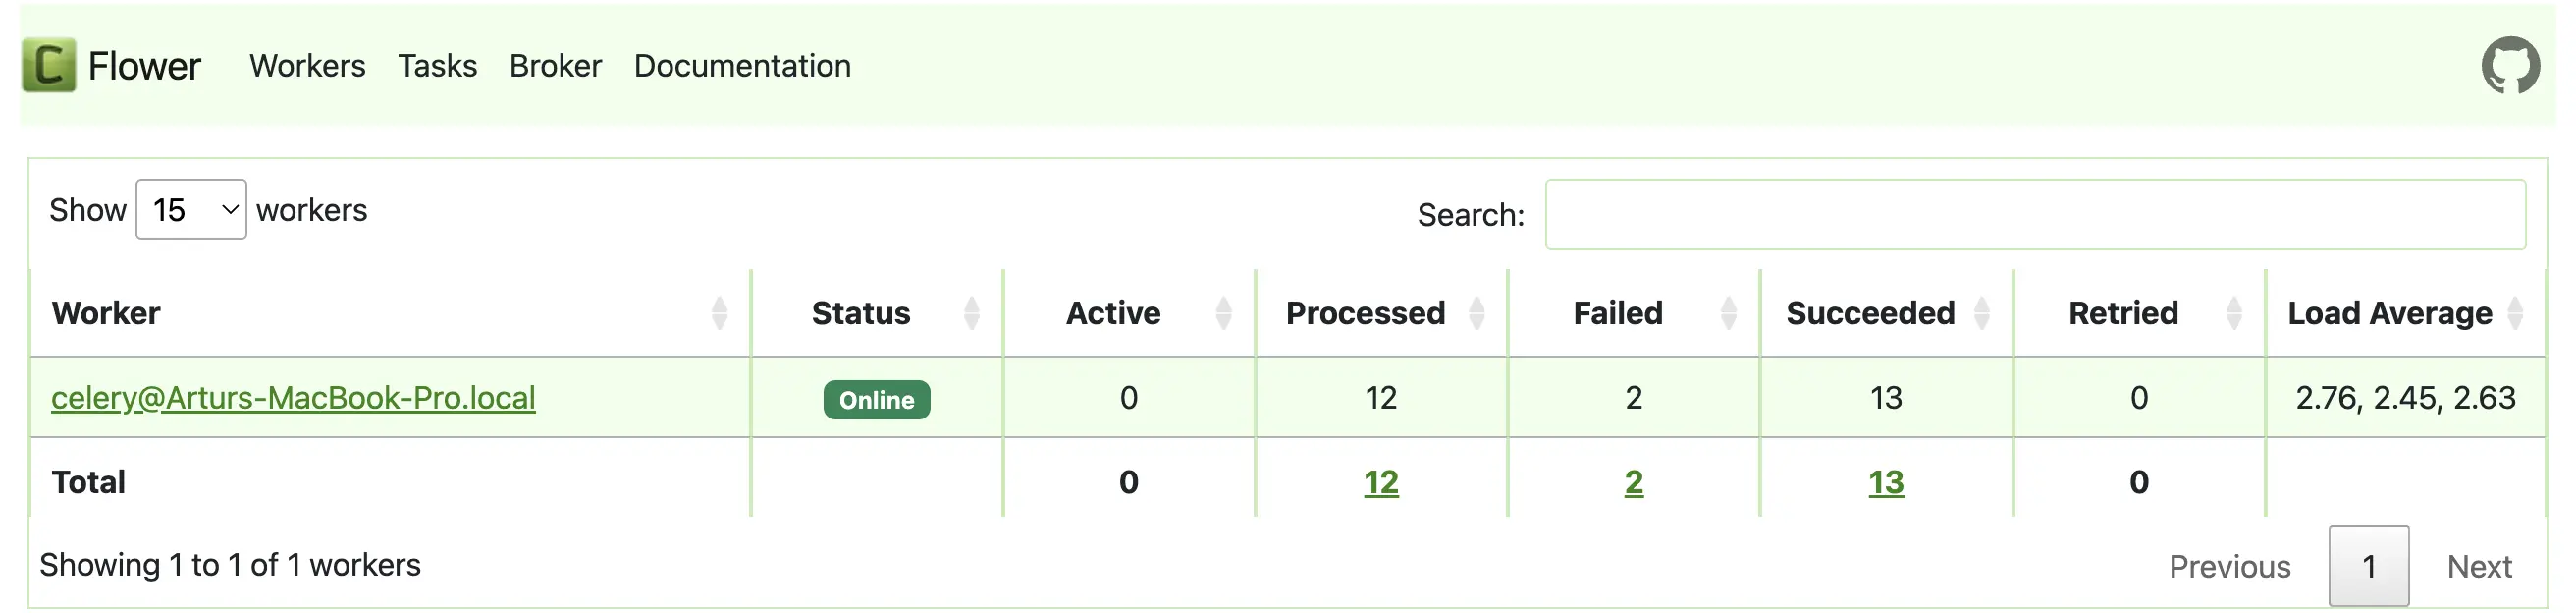
Now, you can start the worker with poetry run start_workers and you will see the worker start up as well as it being reflected in both the Flower dashboard as well as the Grafana dashboard.
To actually use the workers now, you will need to send a POST request to http://localhost:5555/api/task/send-task/add using the basic-auth credentials we set in the docker-compose.yml file. The body of the request should be a JSON object with the following structure (at least in our case):
{
  "args": [1, 2],
  "kwargs": {}
}
Afterwards, you will get a task-id as a response. You can then use that task-id to check the status of the task by sending a GET request to
http://localhost:5555/api/task/info/YOUR_TASK_ID_HERE
As a last bonus, here’s a simple Dockerfile for the workers.
# Use an Alpine-based Python image
FROM python:3.12-alpine

# Set the working directory in the container
WORKDIR /usr/src/app

# Install build dependencies (needed for some Python packages)
RUN apk add --no-cache --virtual .build-deps     gcc     musl-dev     python3-dev     libffi-dev     openssl-dev     cargo

# Install Poetry
RUN pip install poetry

# Copy the current directory contents into the container at /usr/src/app
COPY . /usr/src/app

# Install project dependencies
RUN poetry config virtualenvs.create false     && poetry install --no-interaction --no-ansi

# Remove build dependencies to keep the image small
RUN apk del .build-deps

# Run the application
CMD ["poetry", "run", "start_workers"]
You can then build the image with docker build -t my-celery-app . and run it with docker run --network=celery-flower-combo_default my-celery-app (assuming that that’s the name of the network created by docker-compose). Lastly, in this case you would need to use the container name of the RabbitMQ container as the hostname as well as the container name of the Postgres container as the database hostname. To do that, you would need to change the .env file to the following:
# CELERY_BROKER_URL=amqp://user:password@localhost:5672//
# CELERY_RESULT_BACKEND=db+postgresql://user:password@localhost:5432/main

# use these if you use the dockerfile
#
#
CELERY_BROKER_URL=amqp://user:password@rabbitmq:5672//
CELERY_RESULT_BACKEND=db+postgresql://user:password@postgres:5432/main
That’s it! You now have a working Celery worker setup with monitoring and API capabilities. You can find the full code for this tutorial in this repository.
Closing Notes
In this tutorial, everything was setup using localhost, which is not what you would normally use in production. But the jump from the local setup to the production setup is not that big. All you need to do is to configure the nginx.conf file to use your domain name and then use that domain name in the environment variables of the .env file. You would also need to setup SSL certificates for your domain name, which is a bit out of scope for this tutorial.
I hope you found this tutorial useful and if you have any questions, feel free to contact me on Twitter!
Thanks for reading!